Study area size, selection, and the modifiable areal unit problem
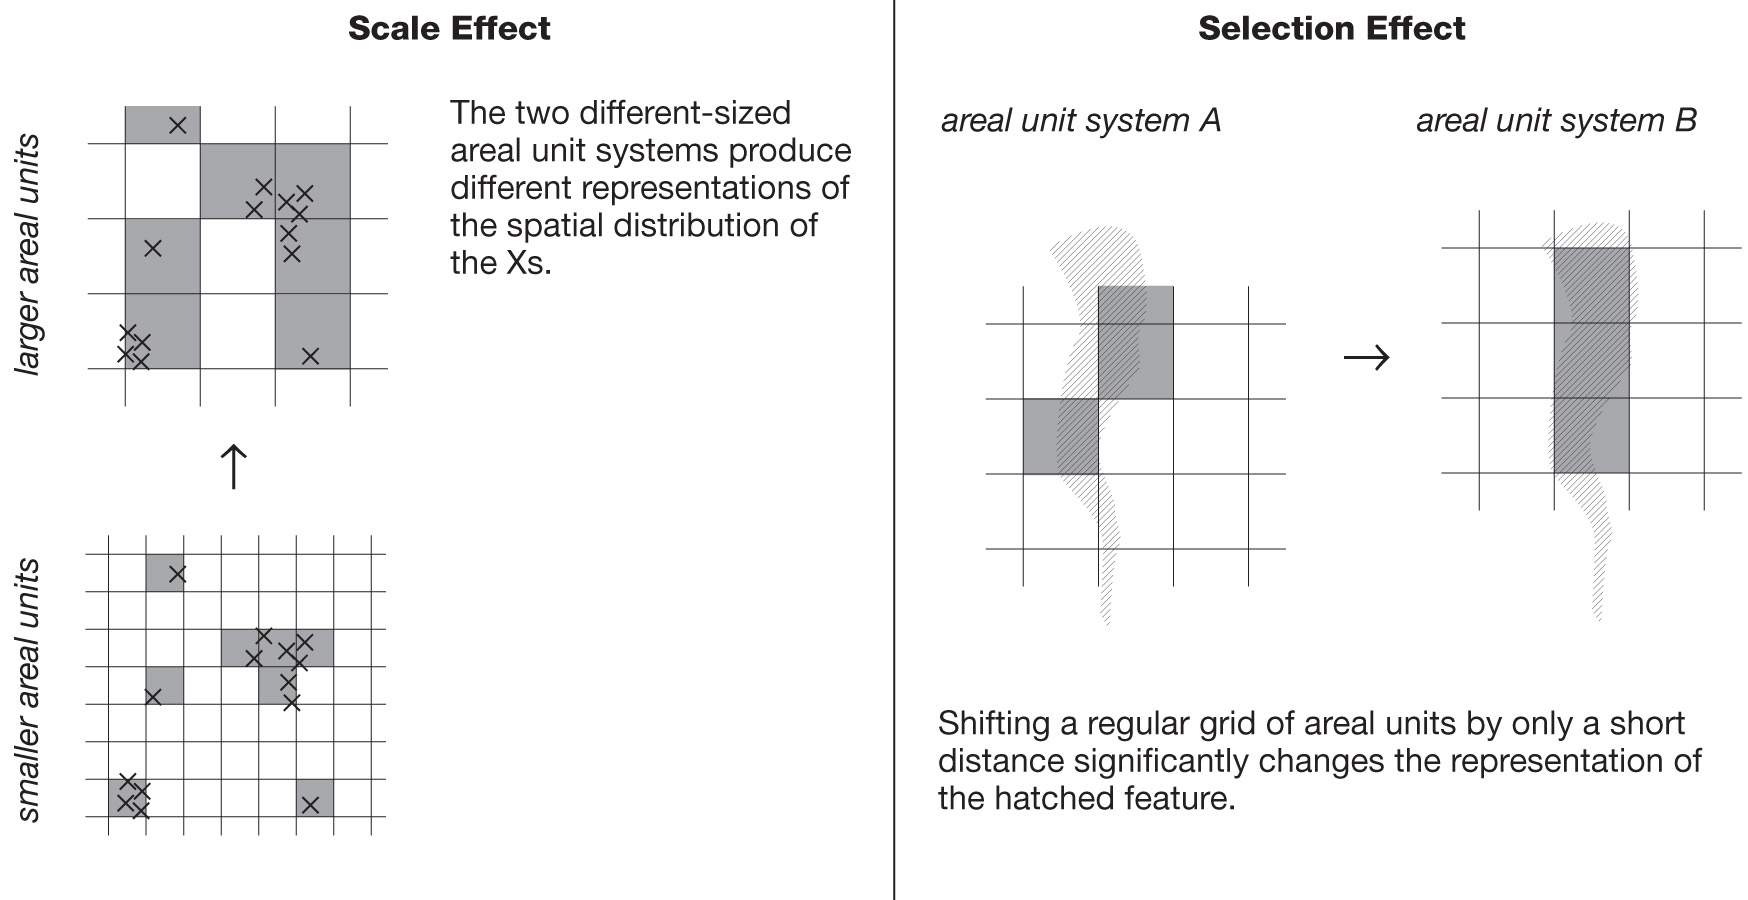
Is the 400-hectare scale appropriate for the analysis reported in Section 2? One way to approach this question is in terms of the modifiable areal unit problem. This term refers to the fact that aggregating data into larger spatial units such as census tracts or traffic analysis zones can affect how the data are interpreted. As Openshaw and Taylor note, "Since a study area over which data are collected is continuous, it follows that there will be a tremendously large number of different ways by which it can be divided into non-overlapping areal units for the purposes of reporting spatial aggregations of individual data" (1981:60). The definition of areal unit systems can have two effects (See Fig. B.1):
- Scale effect: Different results are obtained when the same set of data are grouped into areal units of different size.
- Selection effect: Different results are obtained when the shape or location of same-sized areal units is changed.
The challenge is to devise a system of areal units that minimizes these effects.
Fig. B.1: The modifiable areal unit problem
Openshaw and Taylor distinguish between two kinds of areal unit systems: a priori units such as political boundaries, and a posteriori units, such as standardized grid squares. They prefer to use a posteriori units, defined using objective criteria, but acknowledge that most data available are aggregated to a priori units such as municipalities and wards. Commonly available units such as census tracts, postal code zones, and traffic analysis zones lie somewhere in the middle, reflecting a compromise between subjective political and historical spatial divisions, and objective criteria such as defined population or geographic size ranges and physical geography. The scale and locations of such areal units are typically designed with a particular objective in mind, and may therefore prove unsuitable for some forms of analysis. For example, the boundaries of Canadian census tracts are largely determined on the basis of residential populations and are therefore ill suited to the analysis of employment areas. The population of census tracts ranges between 2,500 and 8,000, with a preferred average of 4,000 (Statistics Canada 2004).
This study was limited in its ability to address the modifiable areal unit problem, because the scale and selection of the study areas was constrained by the format of available data. The number of cases is too small to perform statistical analysis of potential scale effects. Ultimately, given the highly variable and multivariate nature of urban form, one must acknowledge the modifiable areal unit problem and proceed on the basis of what Openshaw and Taylor call the "traditional solution" -- "identify[ing] the zones as meaningful objects to study in an explicit albeit subjective fashion" (1981:63).
Land use data - planningAlliance study areas
Typology of land uses
The firm planningAlliance, Inc. was commissioned to create parcel-by-parcel maps of land use and quantification of land area for 11 study areas. Parcel maps for each study area were drawn from municipal planning documents. The total land area of each category was calculated using CAD software. Where study areas are bounded by roads or railways, the study area boundary is considered to be the centre line of the right-of-way.
Individual parcels were assigned to land use categories through analysis of 2002 aerial photographs, planning documents, and comparison to commercially available road maps (MapArt 2005). This was done according to the typology of land uses shown in Fig B.2.
The Cachet, Richmond Hill, and Vaughan study areas contain vacant parcels. Given the difficulty of synchronizing the census and TTS data, both from 2001, with the land use information, the dwelling and population figures may count subsequent development on vacant parcels, or may capture an earlier moment in time when more of the site was vacant.
The criteria for the assignment of parcels to land use categories are shown in Fig. B.3.
Fig. B.2: Typology of land uses
|
Developable land |
Private property |
a. |
Residential parcels |
|
b. |
Employment parcels |
||
|
c. |
Vacant parcels |
||
|
Public land uses |
a. |
Rights-of-way |
|
|
b. |
Parks |
||
|
c. |
Places of worship and cemeteries |
||
|
d. |
Schoolyards |
||
|
Undevelopable land |
|
a. |
Hazard and environmentally protected lands |
|
|
b. |
Utility and rail corridors |
Fig. B.3: Criteria for assignment of land uses to parcels
|
Residential parcel |
Any parcel that contains one or more residential dwelling unit and is zoned as such. Parcels containing residential apartment buildings that may have ground-floor shops are categorized as residential. |
|
Employment parcel |
Any parcel within or containing business parks, industrial parks, malls, retail power centres, and non-residential parcels containing population-serving employment uses on main streets or embedded in neighbourhoods. |
|
Vacant parcel |
Any parcel designated as developable for residential or employment use in land use plans but that has no structure on it. |
|
Rights-of-way |
Streets, roads, and highways, but not private driveways, roadways, and parking lots within parcels categorized according to the parcel's dominant use. The right-of-way includes not only the paved road width, but also any adjacent boulevard or sidewalk area up to the residential lot line. |
|
Parks |
All public parks, including community centres and other public facilities located within public parks. Public facilities not located on parkland are categorized as employment lands. |
|
Places of worship and cemeteries |
Parcels occupied exclusively by a place of worship or cemetery. Places of worship embedded in the urban fabric (including storefront churches) are not captured. |
|
Schoolyards |
Public and separate school board lands, but not private schools. |
|
Hazard and environmentally protected lands |
Ravine lands, watercourses, floodplains, and other lands designated as off-limits to development. In some cases, these lands function as publicly accessible parks. For the purposes of the land use calculation, these lands were categorized according to their zoning in municipal plans. |
|
Utility and rail corridors |
Rail corridors, TTC and GO station lands and yards, Hydro corridors and lands, and gas line corridors. |
Sources of land use information
All information used was drawn from website viewings in September and October 2005. The following links have been checked and, if possible, updated to those valid as of November 2007.
Oshawa West: Municipal zoning maps and <http: //www.oshawa.ca/eco_dev/lnd_bldg/land2.asp>.
Whitby: Land use <http://www.whitby.ca/pdf/map_quad06.pdf>
Bronte: Aerial ortho imagery 2002 on Town of Oakville website; land use map <http://www.oakville.ca/Media_Files/planning/FIG_I2.pdf>; zoning map <http://www.oakville.ca/Media_Files/planning/91_13.pdf>
Mississauga Valleys: Natural areas survey map <http://www6.mississauga.ca/onlinemaps/planbldg/nas/Site_maps/cc1_my1.pdf>; district land use maps for Mississauga Valleys <http://www6.mississauga.ca/onlinemaps/planbldg/missplan/mvalleys.pdf> and Cooksville <http://www6.mississauga.ca/onlinemaps/planbldg/missplan/cookvill.pdf> districts; zoning categories summary <http://www6.mississauga.ca/onlinemaps/planbldg/zoning/zoningcatagories.pdf>; zoning map with parcels <http://www6.mississauga.ca/onlinemaps/planbldg/zoning/100z21.pdf>; schools are from the Peel District School Board Education development charges background study, p. 176 <http://www.dpcdsb.org/NR/rdonlyres/4230E2EB-4601-41E3-9056-FED0EB6770E8/3480/EDCBkgrdJune04.pdf>.
Milton: Parcels <http://www.milton.ca/plandev/Phasing.pdf>; zoning and land use on the Town of Milton's Onpoint mapping system; land use <http://www.milton.ca/plandev/op_maps/Sch_b_opa.pdf>.
Malvern: Aerial ortho imagery 2002 <http://map.toronto.ca/imapit/iMapIt.jsp?app=TOMaps>; ward 42 map <http://www.toronto.ca/wards2000/images/ward42.gif>; parks and trails map <http://www.toronto.ca/torontomaps/parkstrails.htm>; land use <http://www.toronto.ca/planning/official_plan/pdf_chapter1-5/22_landuse_2006.pdf>
Glen Abbey: Aerial ortho imagery 2002 on Town of Oakville website; land use map <http://www.oakville.ca/Media_Files/planning/FIG_N.pdf>.
Markham Northeast: Aerial ortho imagery 2002: <http://www.exploremarkham.ca/markham/>; municipal zoning maps: hard copy.
Cachet: Aerial ortho imagery 2002: <http://www.exploremarkham.ca/markham/>; municipal zoning maps: hard copy.
Vaughan: Municipal on-line interactive maps and aerial imagery <http://www.vaughanmaps.ca/Default.aspx>; land use <http://www.city.vaughan.on.ca/>
Richmond Hill: Parcel data for block 26 <http://www.richmondhill.ca/webmaps/detailedcon_bl26.pdf>; aerial ortho imagery <http://maps.richmondhill.ca/onpoint/servlet/onpoint?APPID=TRH_Internet_Application&REQUESTTYPE=mapviewer&maptabid=maptab15>; parks <http://www.town.richmond-hill.on.ca/webmaps/NEW_TRH_General_Ref_Map.pdf>.
Note: The majority of the information pertaining to vacant lots came from the parcel map. Parcels that were vacant in aerial photos were coded as vacant.
Land use data - OGTA study areas
In 1995, Lehman and Associates et al. performed an Urban Density Study for the provincial government's Office for the Greater Toronto Area (OGTA) that identified and quantified land uses for 10 study area areas of approximately 2km by 2km, or 400 hectares each. Five were described in detail in the final report. The typology of land uses into which the total land area was divided is shown in Fig B.4.
Fig. B.4: Typology of land uses
|
Land use categories used in the 1995 OGTA study
|
Corresponding categories in the |
||
|
Total land |
Industrial land |
|
Employment land |
|
Flood plain land |
|
Hazard and environmental protection |
|
|
Gross land area |
Public open space |
Parks |
|
|
Schools |
Schoolyards |
||
|
Roads |
Rights-of-way |
||
|
Developable land area |
Residential lot area, places of worship, cemeteries |
||
This typology is simpler than that defined for the other 11 study areas. As a result, the categories were translated into the corresponding categories in the larger typology. The OGTA study definitions of "total land area" and "gross land area" correspond to "gross land area" and "developable land area" in the present study, respectively. There are several inconsistencies between the categories used by the OGTA and planningAlliance. In the OGTA study,
- utility and rail corridors were not accounted for separately;
- places of worship and cemeteries were not accounted for separately, and presumably are incorporated into the residential lot area;
- study areas were chosen to exclude large-scale industrial uses or single-use employ-ment zones;
- population-serving employment uses within the residential urban fabric were combined with residential parcel area under the heading of "developable land area";
- it is unclear whether the "roads" category strictly covered the paved roadway area or if it refers to the full right-of-way.
Despite these inconsistencies, the two datasets are deemed generally comparable for most analyses in this study.
Demographic and housing stock data
The 2001 Census was used to calculate densities and build a detailed profile of the housing type mix and household characteristics for each study area. Data retrieval and analysis was performed by the Cartography Office at the University of Toronto. Fig. B.5 shows the variables retrieved for the census tracts corresponding to each study area. Census tract data were aggregated to the study area boundaries.
In combination with each other, and with the land use information, these data were used to calculate: average household size; the proportion of all dwellings in apartment form, defined as dwellings classified as apartments in buildings with five or more storeys or with fewer than five storeys; and the proportion of all ground-related dwellings, defined as those not in apartment form.
Public facilities
Parkland
The amount of parkland per 1,000 residents and per 300 dwellings was calculated from the population and land area data.
School facilities, enrolment, and capacity
Data on education facilities had been collected from the Ontario Ministry of Education by the Neptis Foundation for a prior research project (Blais 2003). The dataset contains the number of schools, enrolment, and potential enrolment (capacity) for all public and Catholic elementary and secondary schools in the Greater Toronto Area in 2002. For each study area, schoolyard area in hectares per 1,000 residents and per 1,000 students was also calculated.
Fig. B.5: Census variables
|
Census variable |
Sample |
Subcategories |
|
Populationa |
100% |
|
|
Jobsb |
20% |
|
|
Adult labour force (aged 15 and over) |
20% |
* All * Work in the home |
|
Land area of census tract |
n/a |
|
|
Occupied private dwelling units |
100% |
|
|
Average number of bedrooms per dwelling |
20% |
|
|
Average number of rooms per dwelling |
20% |
|
|
Tenure of occupied private dwellings |
20% |
* Owned * Rented |
|
Period of construction |
100% |
* before 1946 * 1946-1960 * 1961-1970 * 1971-1980 * 1981-1990 * 1996-2001 |
|
Occupied private dwelling units by structural type of dwellingc |
100% |
* single-detached house * semi-detached house * row house * apartment - detached duplex * apartment - building that have 5 or more storeys * apartment - building that has fewer than 5 storeys * other single-attached house * movable dwelling |
|
Total number of private households by household size |
100% |
* 1 person * 2 persons * 3 persons * 4-5 persons * 6 or more persons |
|
Median household income in 2000 of all private households |
20% |
|
a. Population was not adjusted for Census net undercoverage, a recognized phenomenon in which the Census fails to capture people for a variety of reasons. Statistics Canada estimates that the 2001 Census undercounted Ontario residents by 3.68%. See Statistics Canada (2001b).
b. The number of jobs within the census tract was established using the census place-of-work question by geocoding respondents' reported work location to census tracts. Jobs data are not converted to full-time equivalents or seasonally adjusted.
c. Definitions can be found at Statistics Canada (2004).
Neighbourhood accessibility
A roadways dataset produced by cartographic firm DMTI Spatial Inc. was used to calculate total street length and the number of intersections within each study area. To avoid double-counting cul-de-sacs, unattached or terminating vertices of cul-de-sac road spurs were subtracted from the total number of intersections.
In addition, the number of points of entry to each study area was quantified by counting up all intersections of streets internal to the study area with the study area edge, not counting corners. The perimeter distance used in this calculation was determined by measuring the outer edge of the census tracts that make up each study area. Comparing values between study areas should take into account the fact that some study areas have impassible edges such as ravines, highways, and rail corridors, and therefore have fewer points of entry. Intersections where two boundary streets of the study area cross were not counted.
Employment
Information on jobs was also taken from the Census, including the number of residents whose principal place of work was in the home. "Place of Work" data were used to determine the proportion of all jobs located in each study area accounted for by top-level North American Industry Classification System (NAICS) codes.
Travel behaviour
Travel behaviour data for each study area was taken from the 2001 Transportation Tomorrow Survey, a transportation behaviour survey conducted every five years by the Joint Program in Transportation at the University of Toronto. The survey is administered to a random sample of approximately 5% of all households in the GTA, Region of Niagara, Wellington County, Simcoe County, the City of Kawartha Lakes, Peterborough County, and the cities of Barrie, Orillia, Guelph, Peterborough, and Orangeville. TTS data are geocoded to Traffic Analysis Zones (TAZs), which are similar in size to census tracts. The TTS collects the travel behaviour for the preceding weekday of every household member over the age of 11. Shopping trips by walking and cycling may be underrepresented due to the survey's methodology. As a result, it does not capture shopping trips that may occur on weekends. Respondents may also be more likely to recall trips by automobile than those made on foot or by bicycle. See <http://www.jpint.utoronto.ca/ttshome/> for details.
For the analysis in Section 2.7, the TTS data were disaggregated by "purpose of trip destination" into "Work," "Marketing" (shopping), and a combined "School" and "Childcare" category. TTS travel behaviour data were not collected for the OGTA study areas Old Oshawa and Meadowvale, because their boundaries do not correspond to TTS traffic analysis zones.
The Census also collects travel behaviour information. On the basis of a 20% sample, the Census records journeys to the usual place of work by employed people over the age of 15. Where Census Tract and TAZ boundaries coincided, the journey-to-work mode shares are compared in the district profiles in Appendix A. For the purposes of this comparison, the two sets of variables were each aggregated to a common set of categories, shown in Fig B.6. In general, the TTS stated higher mode shares for automobile, taxi, and motorcycle combined than the Census, and lower mode shares for cycling and walking. The TTS combined transit mode share was lower than that reported in the Census for eight of the fourteen study areas and higher in the remaining six. In all cases, the difference between the two sets of values was small.
Fig. B.6: Mode of transport categories
|
Census categories |
TTS categories |
Aggregated categories |
|
Auto - driver |
Auto - driver |
Motorized |
|
Auto - passenger |
Auto - passenger |
|
|
Motorcycle |
Motorcycle |
|
|
Taxi passenger |
Taxi passenger |
|
|
Transit |
Local transit excluding GO Rail |
Public transit |
|
GO Rail only |
||
|
Combined GO Rail and local transit |
||
|
Schoolbus |
||
|
Bicycle |
Bicycle |
Non-motorized |
|
Walk |
Walk |
|
|
Other |
Other |
Other / unknown |
|
Unknown |
Density calculations
The following density values were calculated for each study area:
Population densities
- Gross population density = Population / Gross land area
- Developable area population density = Population / Developable land area
- Net residential population density = Population / Residential lot area
Employment densities
- Gross employment density = Jobs / Gross land area
- Developable area employment density = Jobs / Developable land area
Combined population-plus-employment densities
- Gross combined density = (Population + Jobs) / Gross land area
- Developable area combined density = (Population + Jobs) / Developable land area
Dwelling unit densities
- Gross dwelling unit density = Dwellings / Gross land area
- Developable area dwelling unit density = Dwellings / Developable land area
- Net residential dwelling unit density = Dwellings / Residential lot area