Figure 4 compares per capita energy use with other countries.11 "Other sectors" includes both the commercial and the residential sectors. The numbers in brackets in the legend show total per-capita energy consumption for each of the countries and regions. Canada has the world's third highest per-capita consumption of energy, after Luxembourg (included in Europe-13 in Figure 4) and Iceland (not represented in Figure 4).
Figure 4. Per capita energy use by sector in Canada and other affluent regions and countries, 1997
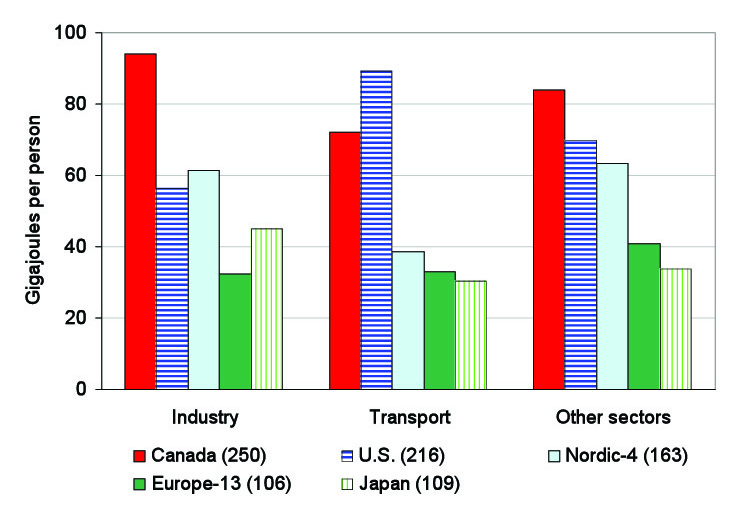
The obvious comparison is with the United States, which has higher energy use for transportation, but lower use for other purposes. The higher use for transportation reflects in part the greater distances travelled domestically by Americans, about 25,000 kilometres per person annually compared with 19,000 kilometres by Canadians and 12,500 by Europeans.12 Canada's higher use for industry could reflect in part the greater prominence of the energy sector--of which the U.S. is the chief beneficiary (see below)--but also lower economic efficiency of Canada's energy use (also see below). Canada's higher use in the residential and commercial sectors could reflect climatic differences.
Figure 4 also provides comparisons with two groups of European countries: the four continental Nordic countries (Nordic-4), and the 13 other countries of western Europe. The Nordic countries provide a better comparison with Canada, being more similar in terms of distances between communities, climate, and the importance of the energy sector. Their per-capita energy use is lower in every respect, especially for transportation. Energy use by other European countries and Japan is even lower.
Figure 5. Energy consumption per unit of GDP, 1997 (legend as for Figure 4)
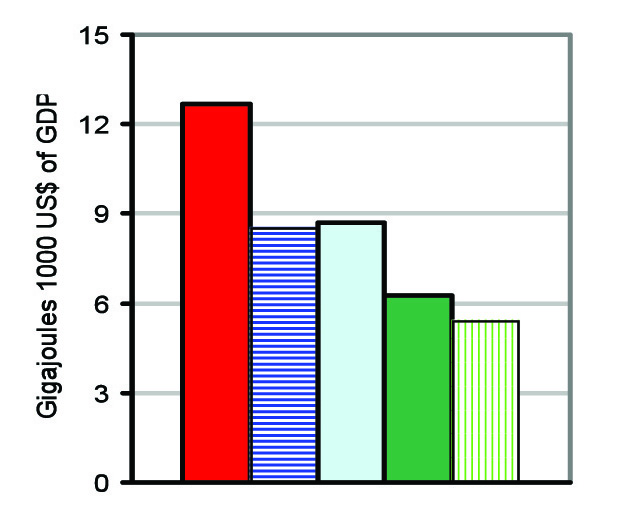
Figure 5 shows comparisons among the same countries and regions of energy consumption per unit of GDP. Canada used more than twice as much energy in relation to its GDP as Japan and non-Nordic European countries, and about 50% more than the U.S. and Nordic countries. The costs of energy use may already be a burden on the Canadian economy, to the extent they raise the prices Canadians have to charge for goods and services. If energy prices increase, the burden will increase proportionate to energy use.
On the other hand, as a major energy exporter, Canada's economy would benefit from higher energy prices. In 2000, net energy exports--chiefly oil and natural gas to the U.S., but also coal to Japan and South Korea--were worth $35.5 billion, ranking second to forestry as a contributor to Canada's positive trade balance.13
Figure 6. Per capita energy use for the movement of people in 52 affluent urban regions, 1995

Another international comparison is shown in Figure 6, which compares per capita energy use within urban regions for the movement of people only.14 Here, the comparison is with the Greater Toronto Area, where energy use per capita was six times that of the urban region with the lowest energy use (Hong Kong), but only about a third of that of the urban region with the highest use (Atlanta). Most of the Asian, European, and U.S. urban regions represented in Figure 6 had--and still have--a higher GDP per capita than the Canadian urban regions, so it's not a simple question of some regions using less energy because they are poorer.