Research approach
Study areas
Section 2 analyses the characteristics of 16 districts of approximately the same size in the Greater Toronto Area.8 Taken together, these cases represent a range of development patterns, locations within the metropolitan region, and time periods of urban development. Land use, demographic, built form, and travel behaviour data were compiled for each of the study areas. These data, which are summarized in Appendix A, constitute a quantitative "portrait" of each case. Appendix B describes the methods and data employed.
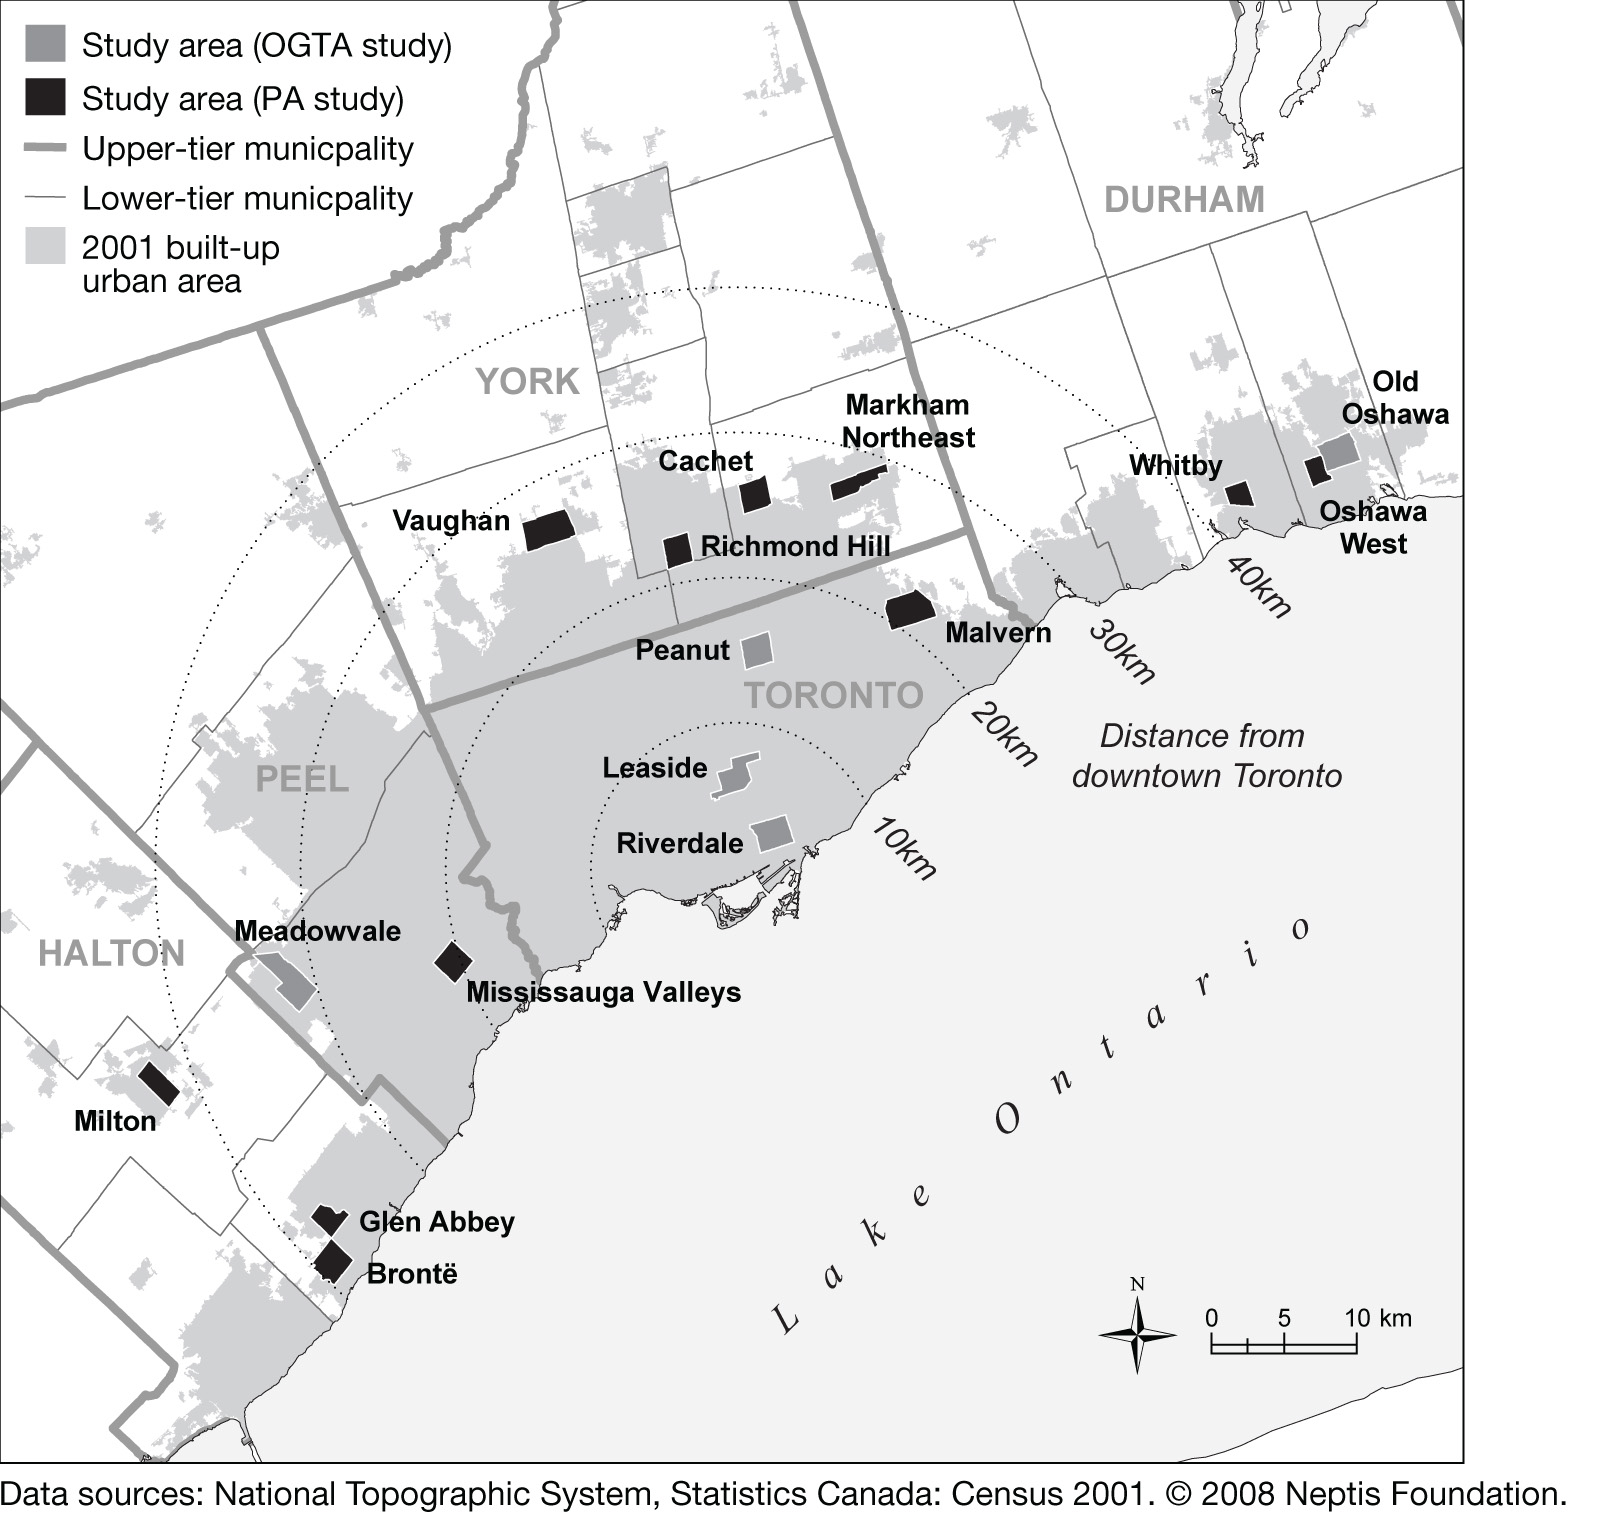
Eleven districts were selected for analysis by planningAlliance, Inc., which mapped and quantified the land uses of each. These were supplemented by adapting land use information for five cases examined in an earlier study prepared for the Office for the Greater Toronto Area (OGTA) by Lehman and Associates et al. (1995). The locations of the 16 study areas are shown in Fig. 5.
Fig. 5: Study area locations
Three criteria guided the selection of the districts: geographic size, location within the region, and time period of planning and build-out. Each is discussed in turn.
Study area size
Each district is approximately 400 hectares. Squares of this size loosely correspond to the grid of concession roads that subdivide the Greater Toronto Area. In 1791, using Queen Street (then called Lot Street) and subsequently Yonge Street as his baseline, Deputy Provincial Surveyor Augustus Jones divided the land into park lots and farm lots of 100 chains. Each of the original farm concessions was 100 chains deep. A chain being 66 feet, 100 chains equals 11/4 miles (2 km). Blocks of land 100 chains on a side contain 1,000 acres (approximately 400 hectares)9 and were bordered by concession and sideroad rights-of-way of one chain in width. These farm blocks were subdivided into five lots, each measuring 20 by 100 chains (Metropolitan Toronto Planning Board 1959:3). The size of the grid varies. In Scarborough and Pickering, for example, blocks are divided into two lots, resulting in sideroads being platted at 40-chain, or half-mile intervals. In Peel Region, a different baseline parallel to the lakeshore was used, producing a grid that is at an angle to Toronto's.
The 400-hectare concession grid is also a useful unit of analysis for policy reasons. It has been and continues to be the basic building block of urban development in Southern Ontario, as reflected in municipal Official Plans. For example, the official plan of the Regional Municipality of York defines a "community" as a "planning area [of] about 400 hectares ... large enough to include employment, recreational and community facilities, as well as housing" (1994:s. 5.2.7(a)). The official plan of the Regional Municipality of Peel contains similar language (1996:s. 5.3.1.3). City of Mississauga official plans have also long defined their planning districts in terms of the concession grid squares. Analogous to Clarence Perry's (1929) neighbourhood unit model, though much larger, arterial roads divide the districts they contain from one another. In principle, the concession grid square is expected to be large enough to contain a broad range of urban land uses and avoid the modifiable areal unit problem (see Appendix B). A 400-hectare square represents an area larger than the typical definition of a neighbourhood or the maximum distance people are willing to walk to access amenities -- usually defined as approximately 500 metres (Ministries of Transportation and Municipal Affairs 1992:53; Calthorpe 1993:56; Southworth 1997:38-39). With some exceptions (mostly due to the inclusion of the five OGTA study areas), the study areas are of consistent size. The districts analyzed range from 253 to 721 hectares, averaging 464 hectares.
This concession-grid scale was used in two previous Toronto-area studies. The 1995 OGTA study prepared by Lehman and Associates et al. collected land use, housing, and demographic information for five 2km-by-2km areas representing segments of urban fabric developed prior to 1980. A Neptis Foundation-funded study by Robert M. Wright, The Evolving Physical Condition of the Greater Toronto Area: Space, Form and Change (2000), also looked at land use in five 2km-by-2km areas, though in terms of building coverage and land use, not density.
Location within the metropolitan region
Study areas were chosen from all of the upper- and single-tier municipalities in the Greater Toronto Area. Three are in Halton Region, two in Peel Region, four in York Region, three in Durham Region, and four in the City of Toronto. This diversity of locations captures a broad range of the local planning policy regimes that have been active in the region over time. A secondary goal of the study is to look for evidence of policy convergence as municipal and provincial planning became more prescriptive and uniform.
Considering a diversity of locations in the metropolitan region also results in a range of locations on the metropolitan density gradient (see Fig. 6). (For a discussion of density gradients, see Edmonston 1985; Bunting et al. 2002; Bunting 2004; Millward & Bunting 2008).
Fig. 6: Density gradient of the Toronto census metropolitan area

The graph shows the distribution of gross population densities of census tracts by distance from Toronto's central business district in 1996. The dotted line indicates the density decay function for 1971; the solid line for 1996. The difference between the two indicates a decentralization of population between the two years. Adapted and redrawn from Millward & Bunting (2008:287).
Fig. 5 shows that two of the cases are located within 10 km of Toronto's central business district; one is between 10 and 20 km from the centre, six are between 20 and 30 km, two between 30 and 40 km, and four are in self-standing towns more than 40 km away. While the planning orthodoxies that shaped their urban fabric are largely the same as elsewhere, the towns of Milton, Oshawa, and Whitby have their own density gradients, employment patterns, and transportation infrastructure. Outside these towns, density and the era in which land was planned and developed as the urbanized area has expanded contiguously outwards generally corresponds to distance from Toronto's central business district.
Era of initial development
Study areas were chosen that represent development patterns associated with periods ranging from before the Second World War to the late 1990s. (For a discussion of the characteristics of different eras of development, see Southworth & Owens 1993; Wheeler 2003; Lang et al. 2006.) To capture a range of eras, the Census "period of construction" variable was used to determine when each study area was built out. (See Fig. 7.) Statistics Canada recorded the proportion of the dwelling stock in 2001 constructed prior to 1946, between 1946 and 1960, between 1961 and 1970, between 1971 and 1980, between 1981 and 1990, between 1991 and 1995, and between 1996 and 2000.
Fig. 7: Dwellings by census period of construction
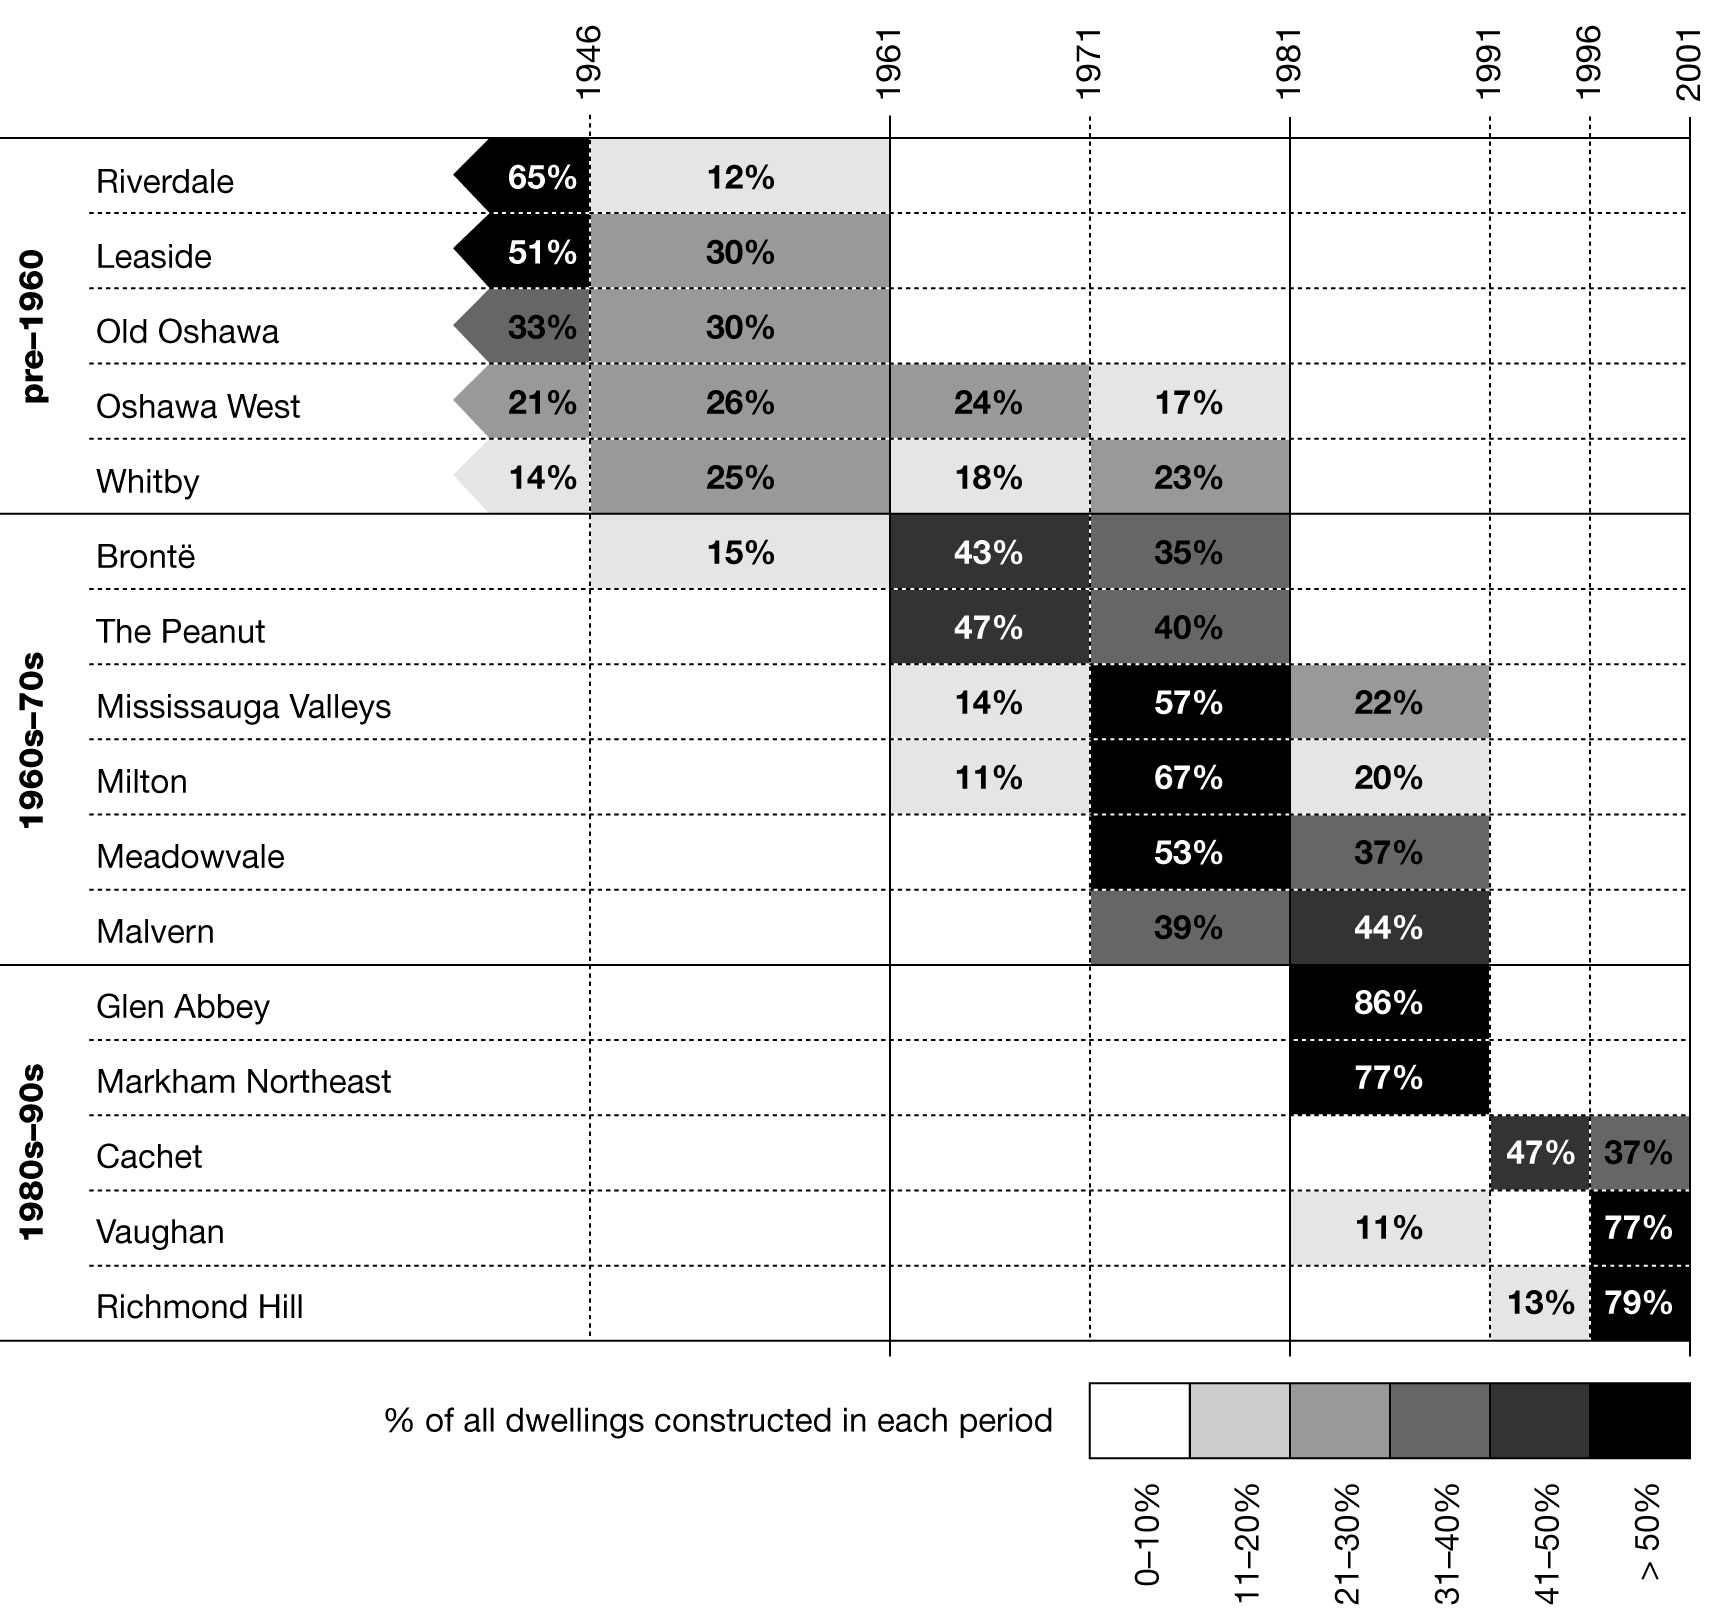
There is, of course, a lag between the time in which land is planned and that in which dwellings are actually constructed and occupied. This lag has become shorter in recent decades. Before 1960, the urban form was largely set in the prewar period (and in some cases, the 19th century), although development was delayed by the Great Depression and the Second World War. In most of the later cases, a single decade accounted for the majority of development activity. This is not surprising given the housing booms that occurred in the 1960s, in the late 1980s, and again in the late 1990s.
Era groups
The study areas are divided into three approximately equal-sized "era groups" on the basis of their characteristics, which correspond to when they were built out: pre-1960, 1960s-70s, and 1980s-90s. The groups share certain characteristics. The pre-1960 (essentially prewar) cases generally feature non-hierarchical street grids, relatively little natural heritage protection, and greater mixture of residential and non-residential land uses.
In the study areas built out between 1960 and 1980, industrial and office activities tend to be located in automobile-oriented campuses near highway and rail corridors. Shopping is located in strip malls and plazas on arterial roads that border neighbourhood units or in automobile-oriented shopping centres. Street networks are organized into a hierarchy in which small streets internal to a neighbourhood are disconnected from major arterial through-streets at the perimeter. Natural heritage systems -- particularly watercourses and surrounding floodplains -- tend to be incorporated into neighbourhood parkland.
The areas built out since 1980 have more segregated land use patterns than those that precede them; indeed, some contain little or no employment land. Jobs are largely concentrated in specialized automobile-oriented business and industrial parks and shopping centres. More comprehensive protection for natural heritage systems helps structure neighbourhood units. Neighbourhood streets remain disconnected from arterials, although some grid elements have been reintroduced in neighbourhoods built in the 1990s. The distinctive characteristics of each era group are summarized in Fig. 8. Land uses in the 16 study areas are mapped in Fig. 9. See Appendix A for full-page maps.
Fig. 8: Characteristics of study areas by era of initial development
|
|
|
Characteristics |
||
|
Study areas |
Era |
Employment Location |
Natural Heritage Protection |
Street pattern and connectivity |
|
Riverdale, Leaside, Old Oshawa, Oshawa West, Whitby |
Pre-1960, and especially pre-1946 |
Non-retail activities are mixed into the urban fabric. Retail activity is largely located on main streets though in some study areas, shopping centres have been inserted. |
Minimal, unless a major feature like a ravine is present. Typically incorporated into parkland. |
Grid, with high connectivity to road systems beyond the study area borders. |
|
Bronte, The Peanut, Milton, Meadowvale, Malvern, Mississauga Valleys |
1960s-1970s |
Non-retail activities are located on dedicated employment lands on highway and rail corridors. Retail activity is located in strips on the border arterials, arterial-oriented plazas, or in "town centre" shopping centres located in the centre of residential areas. |
Some watercourses are protected. Typically incorporated into parkland. |
Curvilinear streets and cul-de-sacs, with minimal connectivity to road systems beyond the study area borders. |
|
Glen Abbey, Markham Northeast, Cachet, Richmond Hill, Vaughan |
1980s- 1990s |
Non-retail activities are located on dedicated employment lands on highway and rail corridors. Retail activity (if present) is located in arterial-oriented malls. |
Substantial protection of watercourses and woodlots. |
Curvilinear in 1980s. Some 1990s study areas feature neotraditional grid elements within the study area, but minimal connectivity to road systems beyond the study area boundaries. |
Fig. 9: Land uses in the 16 study areas
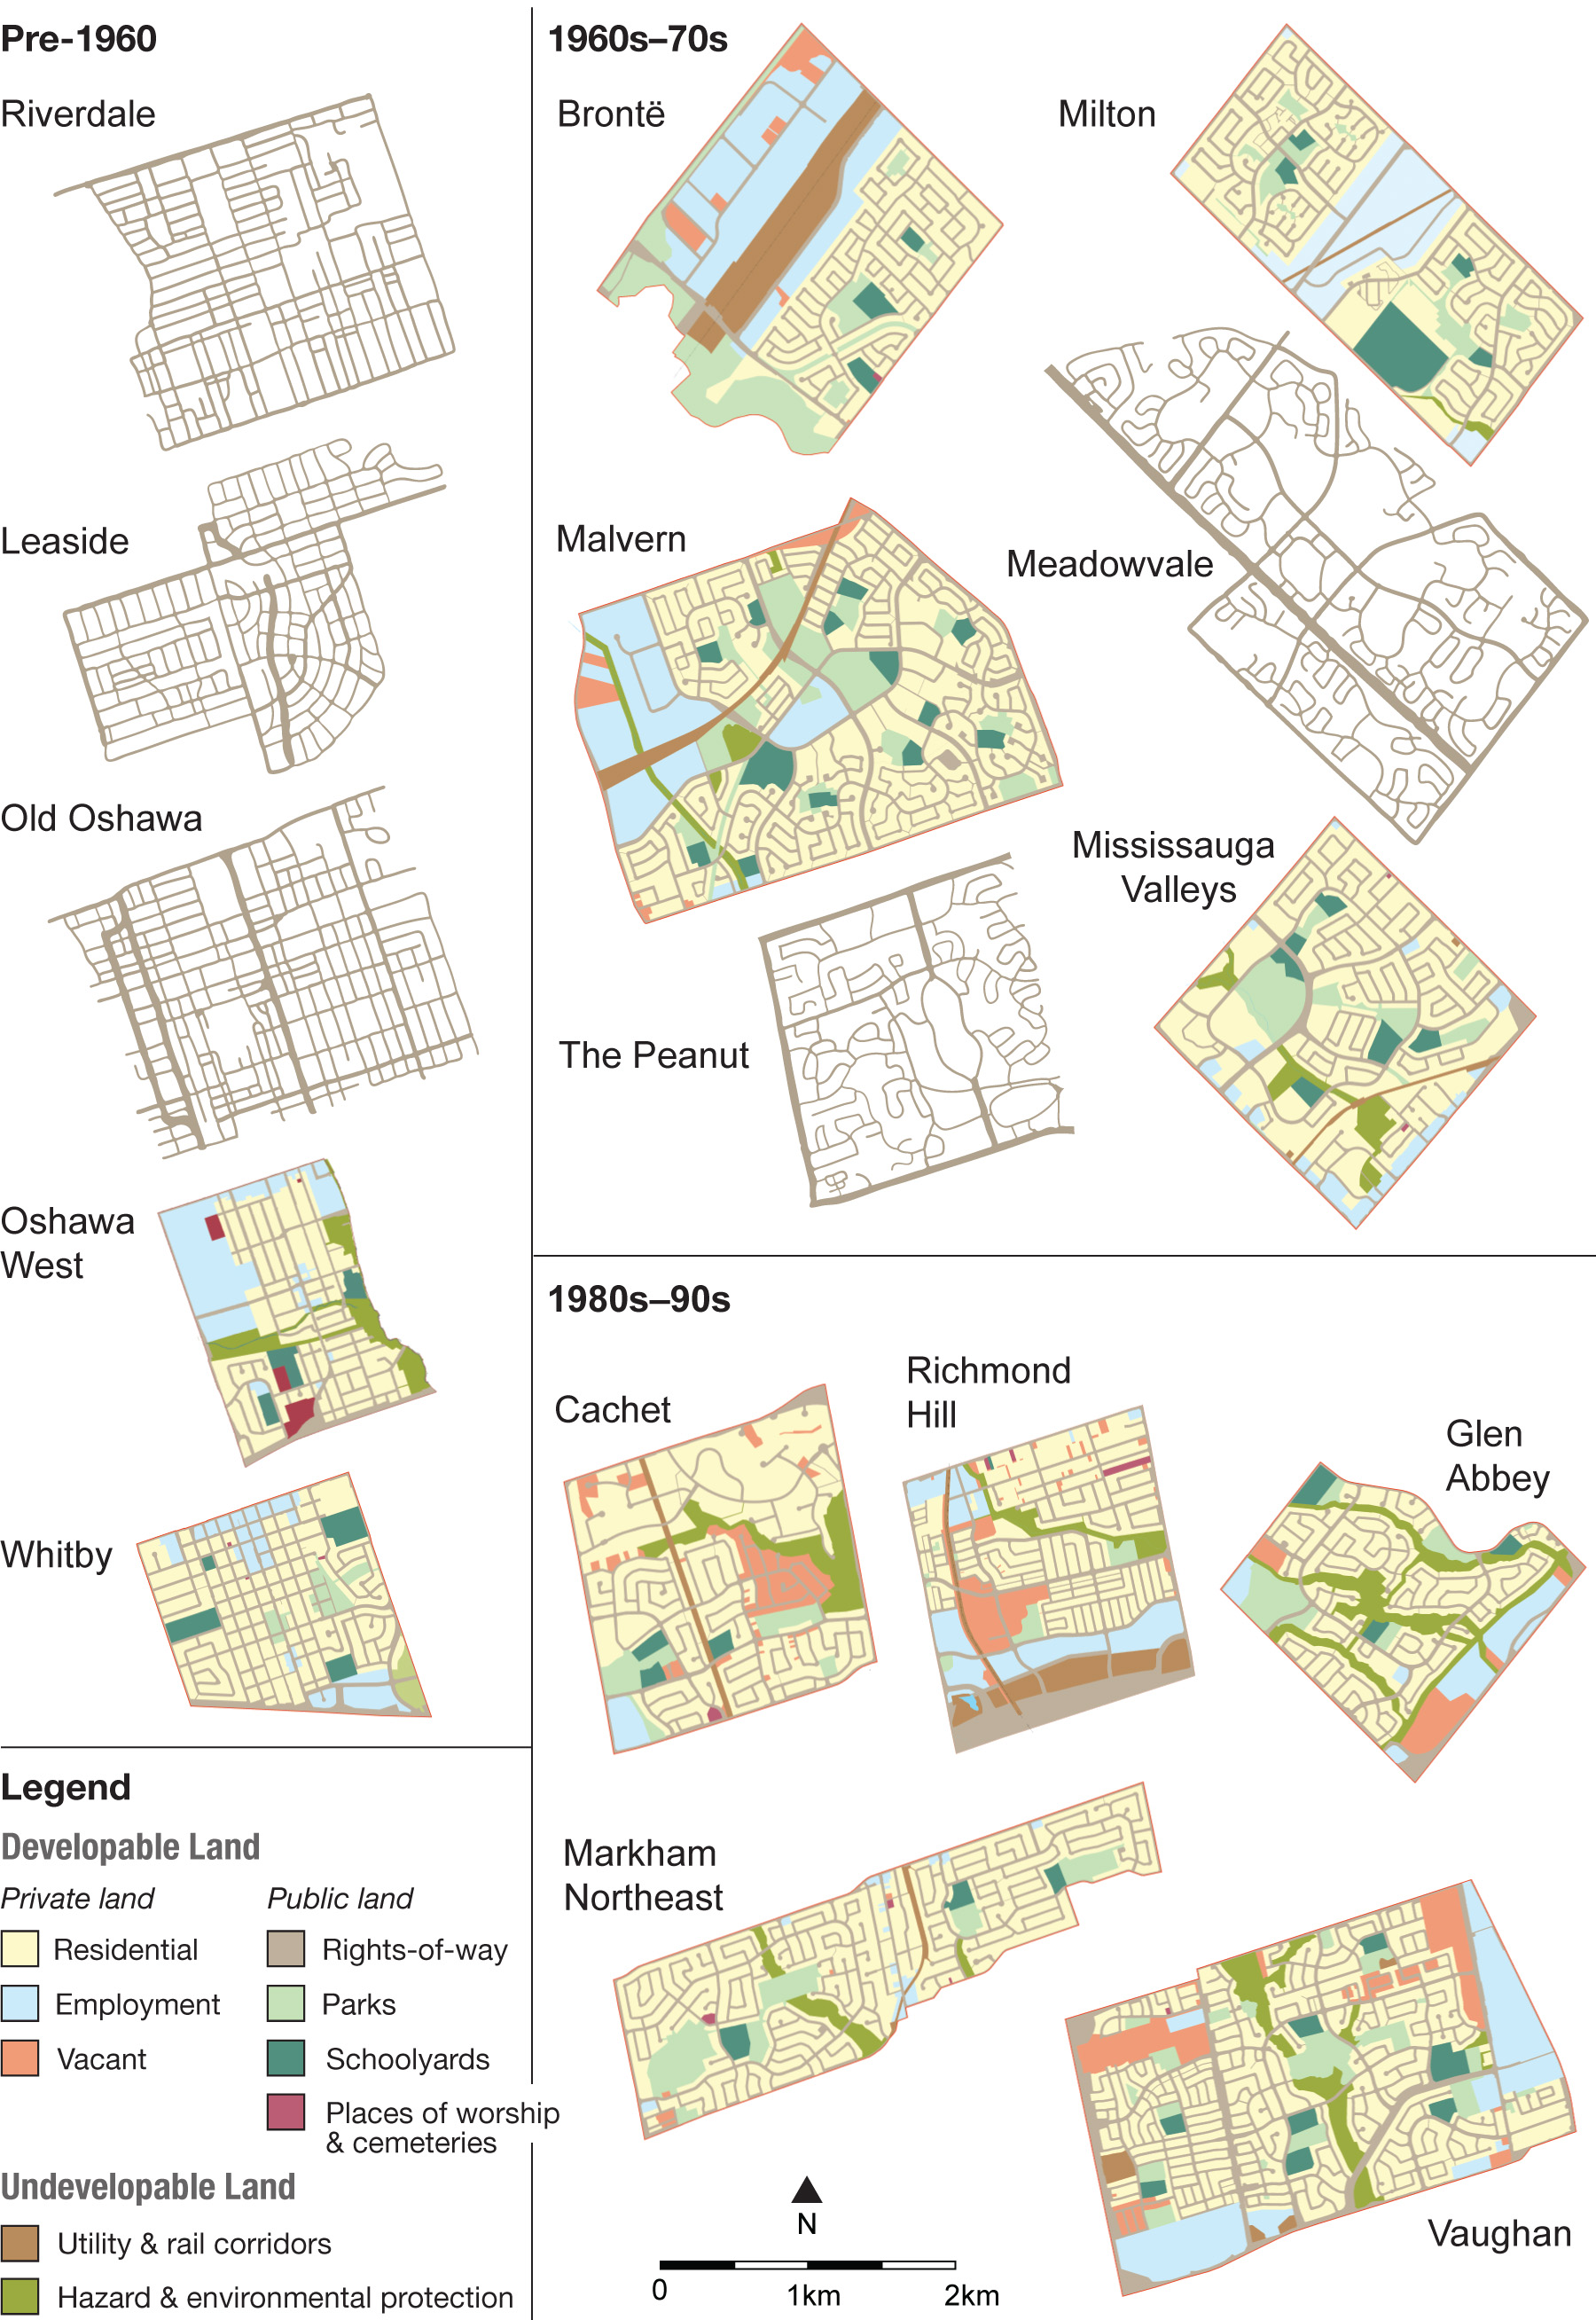
Land uses are not mapped for study areas prepared by Lehman & Associates et al. (1995): Riverdale, Leaside, Old Oshawa, the Peanut, and Meadowvale.
Despite their common features, important variations within the era groups should be acknowledged. Cases in the pre-1960 group, while sharing many important characteristics with respect to the arrangement of land uses, natural heritage protection, and street pattern, vary significantly with respect to density and indicators of travel behaviour. There are several reasons for this.
The oldest case, Riverdale, was built out haphazardly in the 19th and early 20th centuries. Its high density is due to a high proportion of attached housing and small lot sizes. It is also closest to the metropolitan core, and therefore the peak of the urban density gradient, and is well served by higher-order transit. The Town of Leaside was comprehensively planned later, in 1912. It, and the block of streets between Bayview Avenue and Mount Pleasant Rd. that are included in the study area, were built out gradually during the Depression, the Second World War, and into the 1950s. While close to and historically well connected to the metropolitan core by roads and public transit, Leaside's density is lower than Riverdale's because of its different housing type mix and larger lot sizes.
The remaining three pre-1960 study areas -- Old Oshawa, Oshawa West, and Whitby -- are the 19th-century cores of smaller cities that emerged separately from Toronto. Their densities and residents' transportation behaviour differ from the Riverdale and Leaside cases for at least two reasons. First, they experienced large-scale population growth only in the 20th century, after the introduction of statutory land use planning and at a time when the automobile was beginning to dominate transportation. (Indeed, between 1851 and 1951, the former Ontario County, which contained the towns of Pickering, Whitby, and Oshawa, experienced its two largest intercensal population increases in the 1920s, from 46,500 to 59,700, and in the 1940s, from 65,000 to 87,100.10) Second, and perhaps more importantly, these towns, as self-standing central places historically separated from Toronto, have their own density gradients, although their cores are lower density than Toronto's and their public transportation services are less comprehensive and frequent than those in the areas served by the Toronto Transit Commission.
The 1960s-70s and 1980s-90s era groups are more internally consistent in their attributes, the principal exception being the construction in some cases of large numbers of rental apartments in the 1960s and 1970s, which affects observed density and travel behaviour. Mississauga Valleys, the Peanut, and to some extent Meadowvale and Malvern are classic apartment neighbourhoods, featuring tower-in-the-park layouts. The remaining post-1960 cases predominantly feature street-oriented attached and detached ground-related housing.
Correspondence of dataset geographic boundaries
The selection of the study areas was constrained by the fact that the geographic boundaries of available datasets do not always correspond with each other or with the concession grid system. In both the Census and the Transportation Tomorrow Survey (TTS), geographic boundaries are typically aligned with arterial roads and therefore can be aggregated to land areas that coincide with the concession grid. In some cases, however, the shape and size of the data boundaries deviate from the grid, instead conforming to natural or constructed features that interrupt it, such as rail lines, highways, and ravines. Further, Census and TTS boundaries themselves do not always correspond, especially in recently developed areas located closer to the edge of the contiguous urbanized area.
Generalizability of findings
This study strikes a balance between aggregate analyses of metropolitan regions that are limited in their level of detail, and in-depth, idiosyncratic studies of districts or neighbourhoods. Working at this "meso" level, it is possible to make limited generalizations while engaging in in-depth exploration of the interaction between many variables.
A 16-case study is large in comparison to similar studies. For example, Southworth (1997) and Scheer and Petkov (1998) both examined three cases, Knaap et al. (2005) and Wright (2000) five, Weston (2002) seven, Southworth and Owens (1993) and Lund (2003) eight, and Moudon et al. (1997), Hess et al. (1999), and Siksna (1997) twelve. In general, these studies analyze cases selected on the basis of informed judgment rather than random selection. While some of these studies are predominantly descriptive, others statistically test the effects of one or more variables.
This study does not attempt to systematically control for variables such as average household income, average property values, location on the metropolitan density gradient, household size, transit service, or rate of automobile ownership. Given the large number of variables under consideration, to do so would be difficult, if not impossible. Any piece of land and its occupants will be atypical in some way. Indeed, almost every analysis performed in this study reveals anomalies of one type or another. Potential explanations for outlying values and anomalies are discussed in the text.
Presentation of information
Each topic section begins with a review of relevant academic and professional literature. This sets up research questions that are then tested through analysis of the data. The findings, their relationship to the broader literature, and their implications for policy, are summarized at the end of each section and interpreted further in the report's conclusion.
In the analysis, the study areas are sometimes presented as groups, most often by era of development. Where graphs display average values for groups of study areas, the highest and lowest value of the study areas within the group are indicated to give a sense of the degree to which values vary within the group.
While for the most part, general trends and relationships are discerned through observation rather than statistical analysis, the study also seeks to test potential relationships between variables. On one occasion -- exploring the relationship between net residential density and housing type mix -- a linear regression is performed (see Fig. 29). This indicates the degree to which variation in one variable (density) is dependent on the other (housing type mix). The reader is advised that linear regression is considered unreliable when applied to a small number of cases. These results should therefore be taken as indicative rather than definitive.
It should be noted that the land use analysis of the five cases drawn from the Lehman and Associates et al. (1995) study and the analysis by planningAlliance of the other eleven cases employed slightly different land use categorizations. As a result, the Lehman and Associates et al. data likely understate employment land and overstate residential lot area. These differences and their implications are discussed more fully in Appendix B and are acknowledged in the text where appropriate.
Notes
8. The Greater Toronto Area comprises the City of Toronto (formerly the Municipality of Metropolitan Toronto) and adjacent Regional Municipalities of Halton, Peel, York, and Durham.
9. Greater Toronto's grid of arterial roads -- 2,000 metres on each side, enclosing 400 hectares -- is coarser than that in many other North American cities. In the Canadian prairies and American West and Mid-West, surveyors divided the land into smaller square-mile "sections" of 260 hectares.
10. Source of 1851-1941 data: Statistics Canada, Census of Canada, Volume I - General Review and Summary Tables (1941) 563-65. Source of 1951 data: Statistics Canada, Census of Canada, Volume I - Population (1951) 2-1-2-4. Values are rounded to the nearest hundred.