Figure 1 summarizes CMHC data on housing starts in the Greater Toronto Area, from 1987 to 2004. This period is more or less equivalent to one housing market cycle. Over the entire period, GTA housing starts averaged 33,678 units per year. They peaked at more than 50,000 units in 1987 and again in 2003.
Figure 1: Housing Starts in the GTA, 1987 to 2004
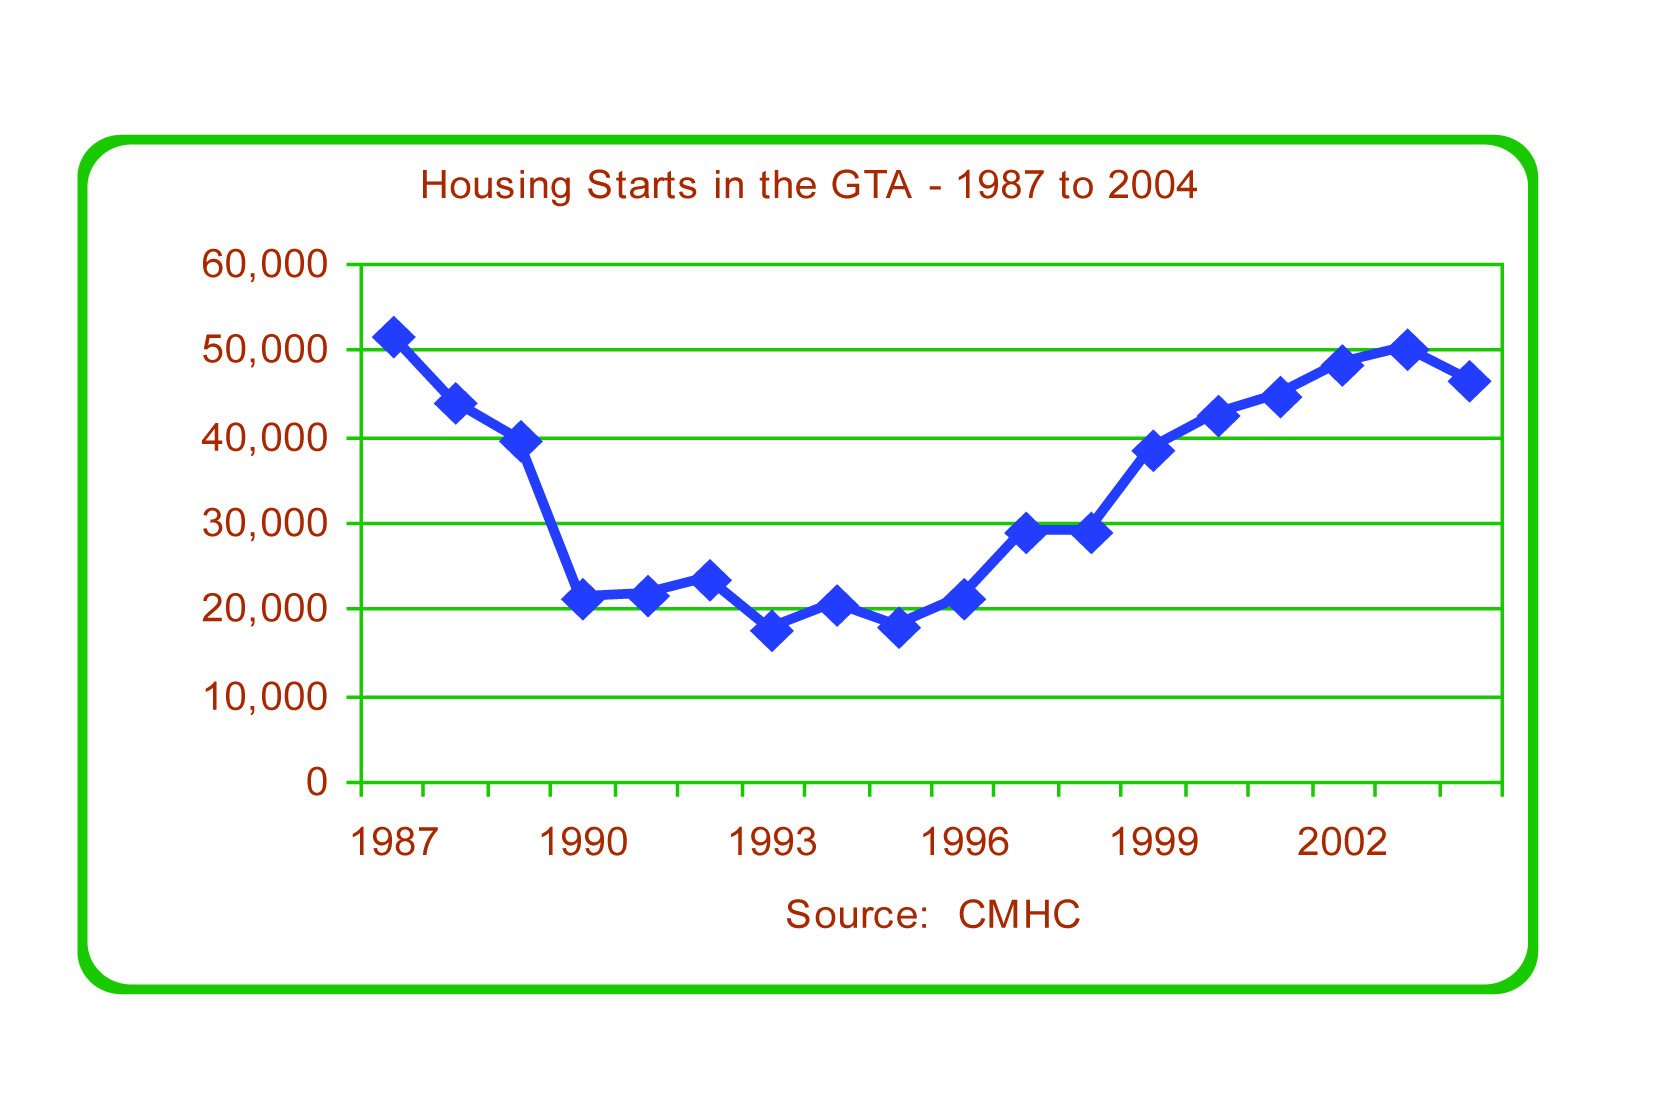
Between these peaks, the market cycle was low from 1990 to 1996, when starts averaged 20,444 units per year. Starts were actually bolstered during that period by an aggressive program of assisted rental housing development, which represented an average of 4,039 starts per year. If those starts are excluded, unassisted development averaged 16,405 units per year between 1990 and 1996. During the recent period of market strength (1999 to 2004), housing starts averaged 45,098 units per year.
Housing starts fell by 7.6 percent in 2004, to 46,372. Although this number is above the long-term average of 33,678 per year, it appears that the current housing market cycle peaked in 2003 and that housing construction may now be slowing.
An additional perspective on the housing market cycle in the GTA is provided by data on new home sales from the Greater Toronto Home Builders' Association (GTHBA). Figure 2 summarizes annual total sales between 1981 and 2004. This longer period represents about two market cycles, during which sales averaged 25,400 units per year. In the weak market period between 1990 and 1996, sales averaged 13,200 units per year; during the strong period of 1999 to 2004, sales averaged 43,200 units per year.
The GTHBA data show that sales of new homes peaked in 2002, per year earlier than the peak shown in the CMHC data on housing starts. In the housing production process, the sale of a new house or apartment almost always occurs before construction starts. The data from GTHBA therefore confirms the conclusion from the CMHC data, that the recent housing market cycle has passed its peak.
Figure 2: New Home Sales in the GTA, 1981 to 2004
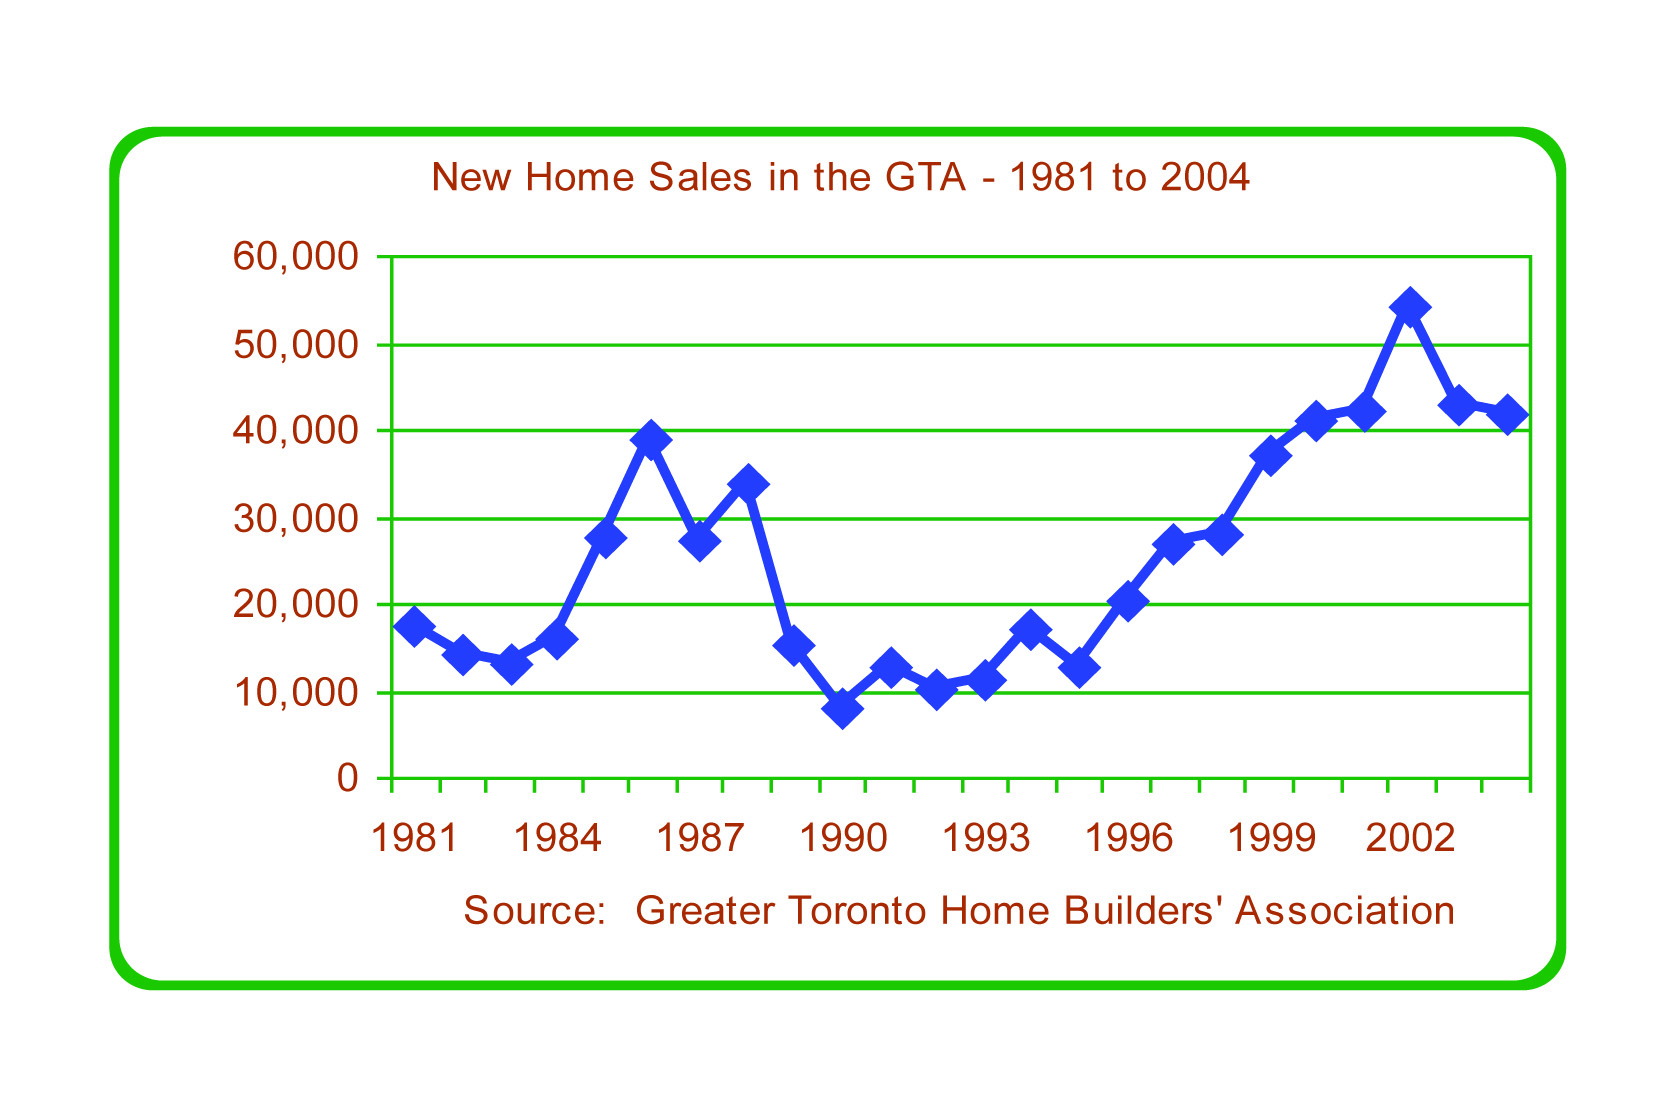
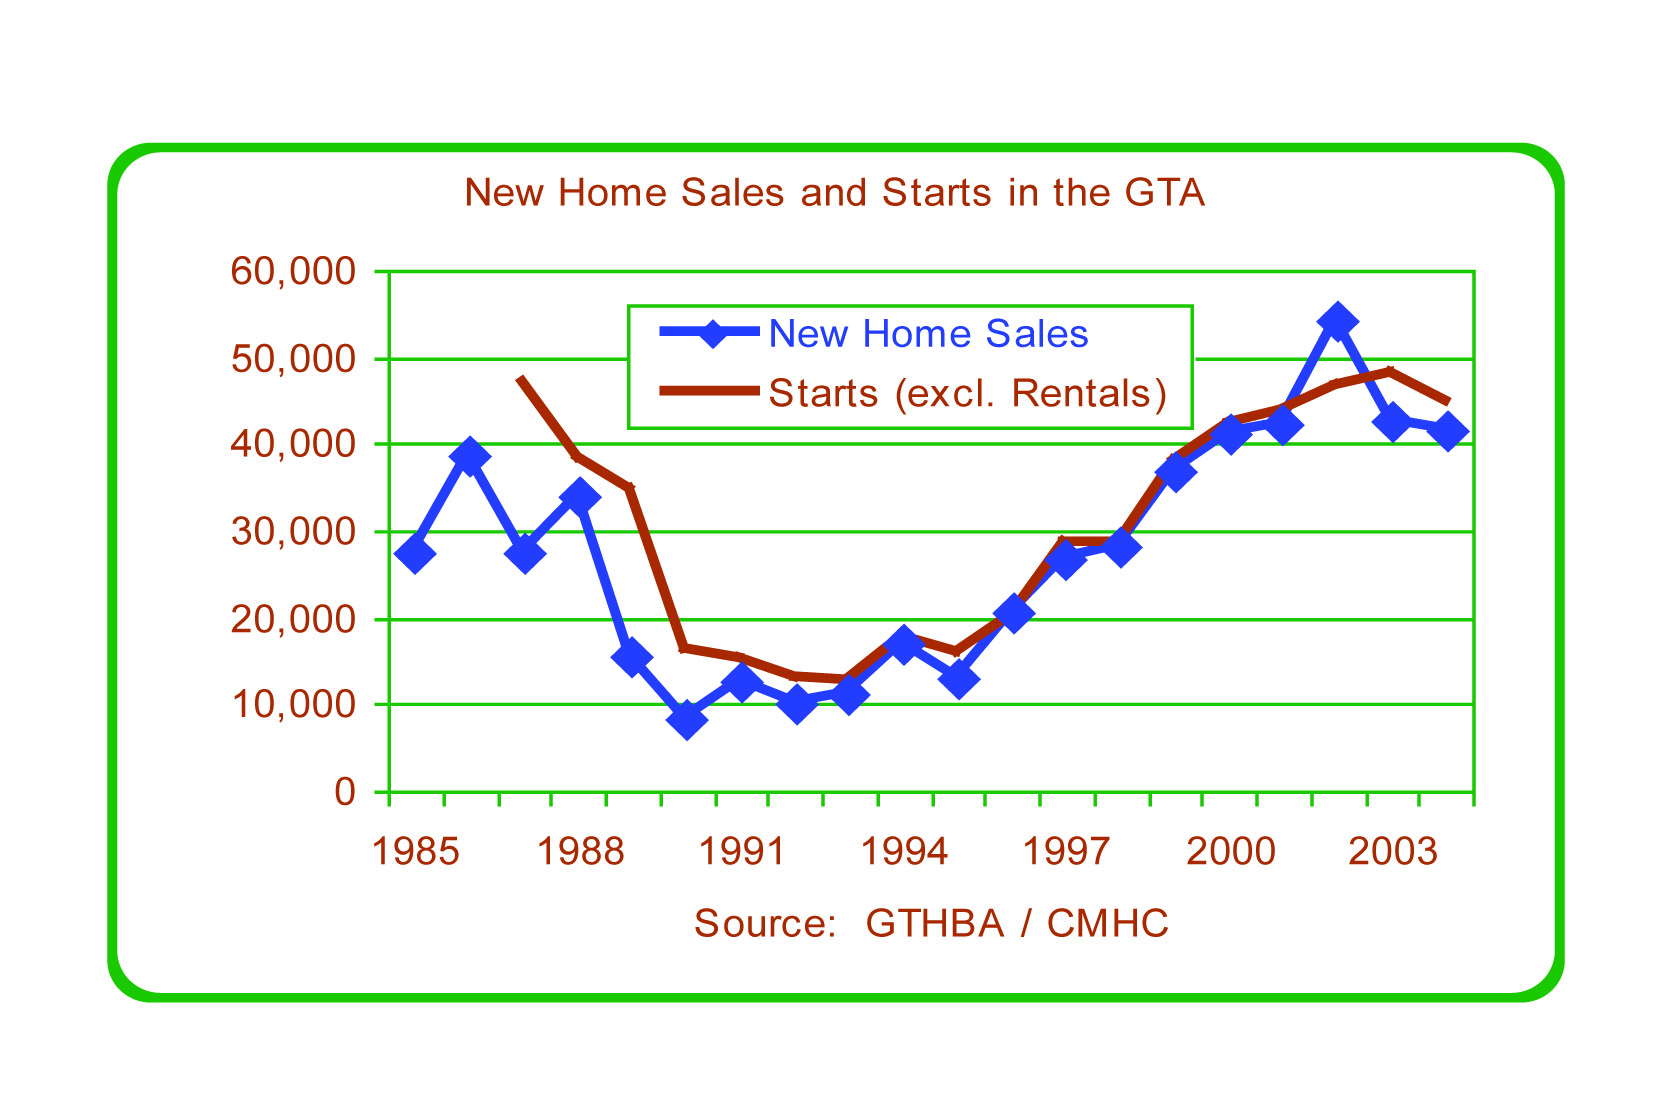
Figure 3 overlaps data on new home sales from the GTHBA and on housing starts from CMHC. Since the GTHBA data excludes purpose-built rentals, the CMHC data has been adjusted to exclude purpose-built rentals. The results reinforce the conclusion that the current housing cycle has passed its peak.
Figure 3: New Home Sales and Housing Starts in the GTA, 1985 to 2004
Very recent data on new home sales shown in Figure 4 provides an even stronger indication that the market cycle has peaked and is now in decline. The trend line (the smooth black line) for seasonally adjusted sales is falling.
Figure 4: Monthly New Home Sales in the GTA, 1995 to 2005

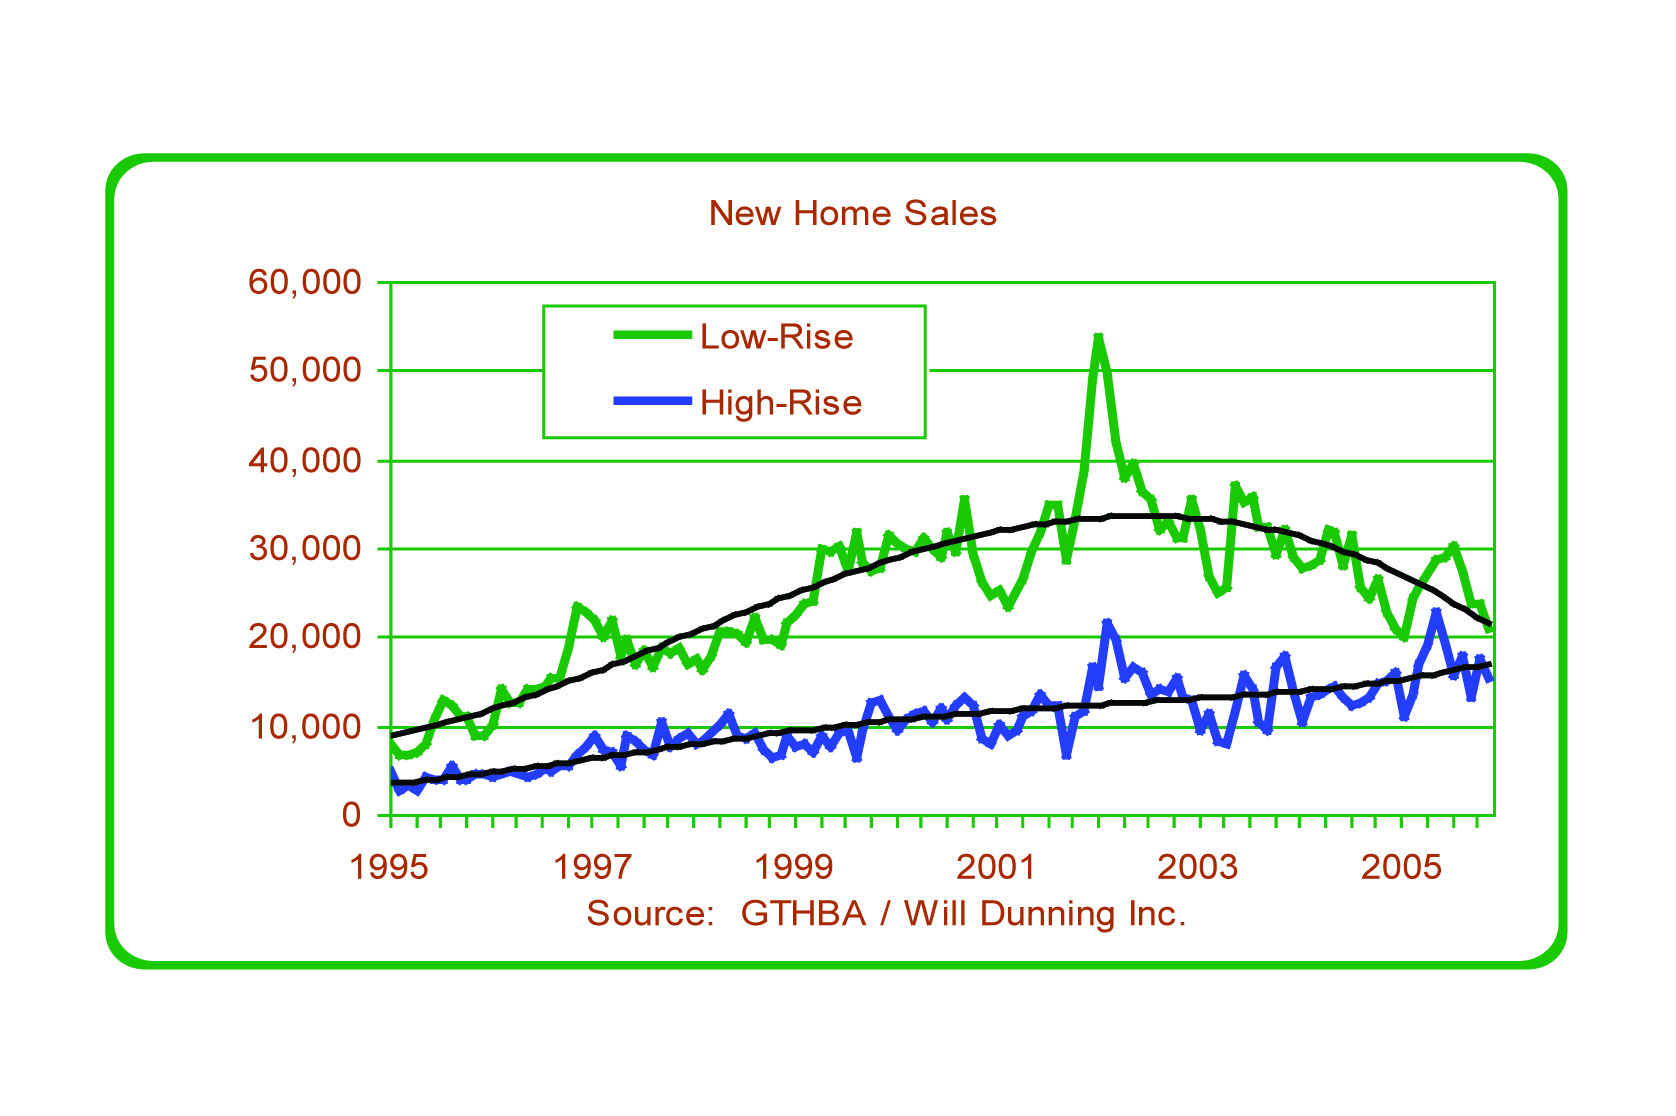
Figure 5 separates new home sales into two components -- low-rise sales (single-detached, semi-detached, and townhouses) and high-rise sales (apartment condominiums).
Sales of low-rise homes fell sharply in the second half of 2004 and, despite the recent partial recovery, the trend line is now at its lowest level since 1998. In the high-rise market (which is centred in downtown Toronto) the trend remains strong. This trend contrasts with the low-rise market, which is focused on the municipalities outside Toronto.
Figure 5: New Home Sales in the GTA, by Low-Rise or High-Rise, 1995 to 2005
Before 2002, new home sales data were divided between freehold tenure versus condominium tenure (which can include condominium townhouses); starting in 2002, the division is between low-rise (which includes condominium townhouses) and high-rise (apartments only). To ensure comparable data, the author estimated low-rise versus high-rise distribution for the pre-2002 data.